
Ilya Volodarsky
Though analytics can be a pretty overwhelming topic, this starter kit should help you strip out the complexity to get up and running.
Entrepreneurs have a lot of urgent things to worry about — and if we’re being honest, analytics is rarely high on the to-do list.
But without analytics, it’s difficult to get a clear understanding of when and how customers are engaging with your product, and as an early-stage startup, it can take far longer to see whether you’ve discovered product-market fit.
These blind spots matter, and can make the difference between a startup’s success and failure.
Though analytics can be a pretty overwhelming topic, this starter kit should help you strip out the complexity to get up and running.
Understand why you need analytics
Simply put, analytics can give you a huge advantage.
In a world in which digital adoption has been accelerated by COVID-19, it is more important than ever before to stand out for the quality of your digital customer experience. Success means knowing your users: who they are, what they want, and how they use your product.
With a strong analytics foundation, you’ll know exactly how to turn customers into loyal, long-term supporters of your brand.
Data analytics is also crucial to strategic decision-making. You might have a gut feeling that something is or isn’t working, but your instincts can often be wrong and it’s important to test them.
Let’s look at a hypothetical example. A startup is profitable and working hard to increase its revenue, but realises at the end of year that the numbers are stagnant despite hundreds of new customers signing up. Looking at the data reveals the fuller story. It turns out the company is only retaining users for about three and a half months, causing them to lose as much revenue as they gain during the year.
I’ll dig into retention metrics later, but the example shows just how crucial analytics can be. Good data gives you a clear understanding of your business, product and customers, and a no-nonsense, early view into product-market fit.
In the early stages, every startup should be asking:
- Do we have product-market fit?
- Are users going to continue using our product long enough to grow our revenues?
- When people do drop out of the customer journey, where is that – and why?
The fastest way to uncover these insights is through first-party customer data – the data about how your own customers are using your product. This information can help you understand important user trends. How many sign-ups were there this week versus last? How many users are coming back week after week?
So, putting in place a strong and intentional approach to analytics – even before you have a large customer base – can help to fuel rapid early growth and save you from the unknown. Even better, it will set you up for the future, so you can cope with ever higher numbers of customers as your company grows.
Choose metrics that matter
Every business – even a young startup – can quickly generate mountains of data. Because of that, it’s essential to decide exactly which metrics you want to focus on before getting anywhere near an analytics tool.
Picture your business as a funnel; a series of steps in the customer journey.
In the early days, while you’re still seeking validation and perfecting your product, you should focus on the acquisition, engagement and monetisation stages of your funnel – three key steps that will provide you with powerful metrics to speed up your early growth.
For example, if your business were Spotify, this is what each step in the funnel could look like:
- Acquisition: How many new users are signing up?
- Engagement: How many users are listening to music?
- Monetisation: How many users are upgrading to a paid premium account?
Once you know what you’re measuring, you can start to add time frames to each metric to create a simple tracking plan based on the three stages of your customer journey.
How many sign-ups did you have this week versus last? How many users renewed their subscription this month versus the same time last year? How has listening time changed over the year?
Start building your data toolkit
Once you’ve thought about which metrics to focus on, you can then start to think about which tools you need to use. These range from basic analytics and diagnosis tools to email, marketing, data governance and attribution tools.
There’s a lot to choose from, so I recommend starting with a handful, rather than going in all guns blazing.
For young startups, Google Analytics is a powerful tool for basic, top-of-the-funnel analytics. Then, when things get a bit more advanced, Mixpanel and Amplitude are great choices.
If you’re still in the test-and-learn phase, live chat software such as Drift and Intercom provides a good way to source direct, qualitative customer feedback that you can work into your developing products and services.
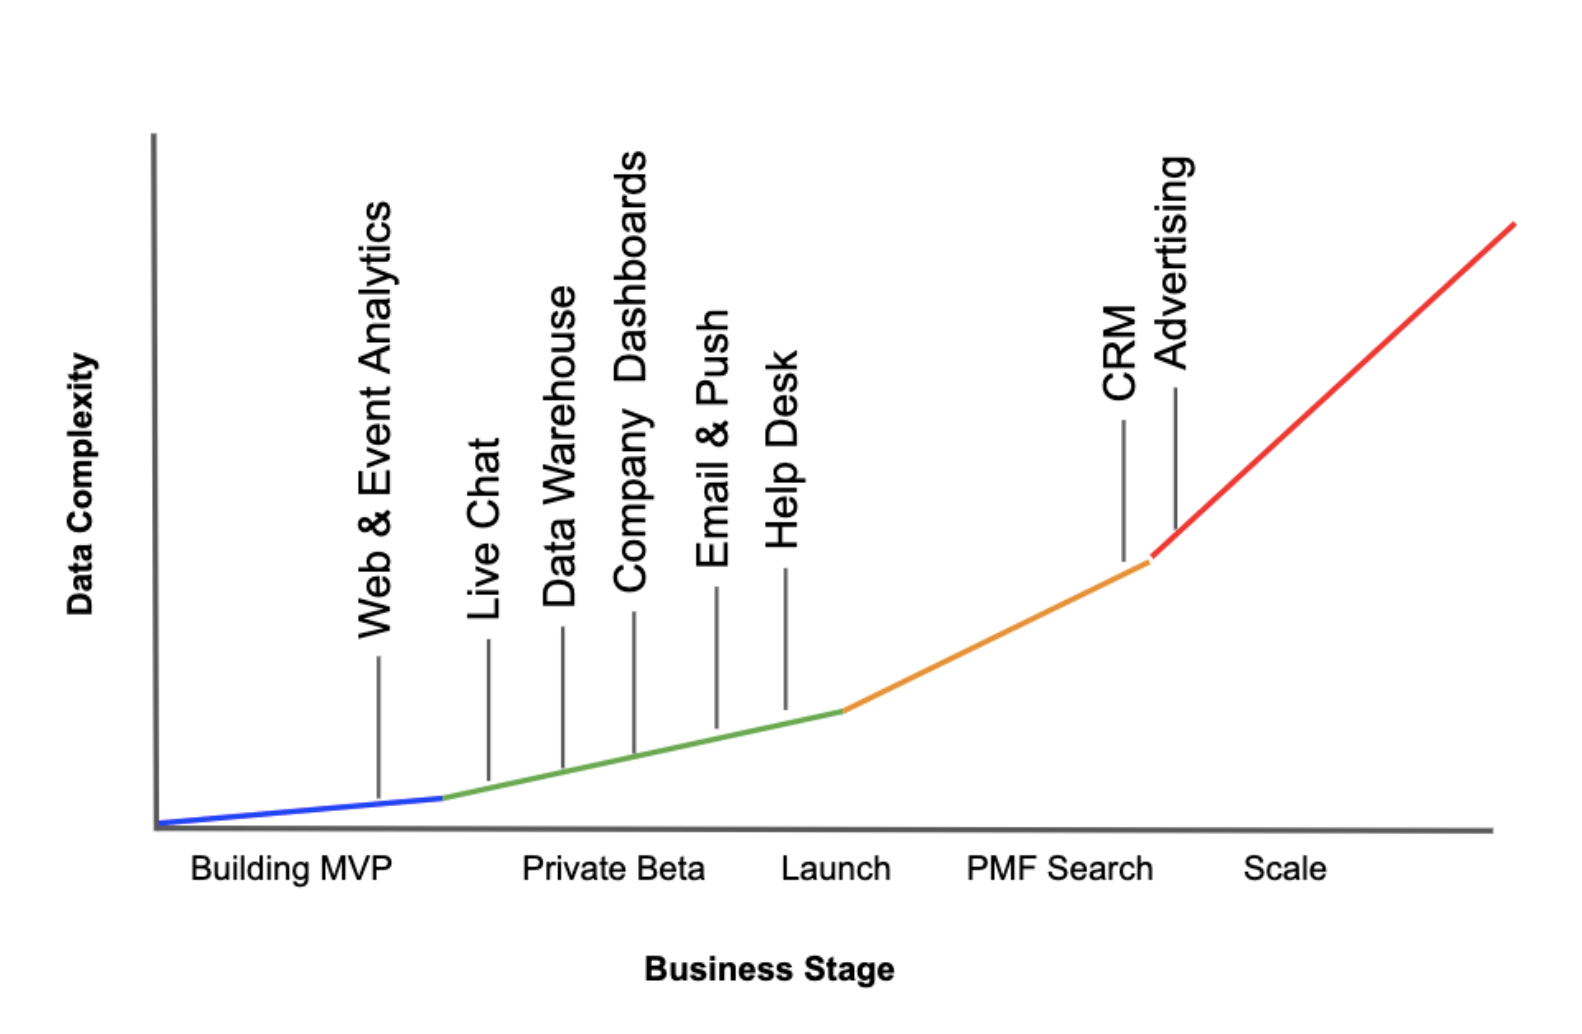
Here’s a graph that shows how a startup’s data stack typically evolves over time (for more examples, see here). Note how tools are layered into the analytics stack as the company’s focus shifts from building a minimum viable product (MVP), to searching for product-market fit and eventually scaling the business.
For early-stage startups, it’s better not to build your own tools in-house. There are so many data and analytics tools in the market right now that there’s bound to be something that fits your company’s exact needs, releasing precious time for your engineers to put into your core product.
Test-driving tools are also a good idea. Most offer a free trial period, which gives you the chance to test them out in a real-world environment. As you assess your options, remember that the true cost of a tool goes way beyond the price that’s advertised – for example, you need to think about how much maintenance it will require from your engineering team over time, and how long it could take to get set up. That said, with a good customer data platform in place, it should be quick and easy to switch new tools in and out.
Whichever path you take, a key part of the decision process is integrating each tool at the right moment. This will help stop you from buying expensive tools too early or continuing to use basic tools once you’ve outgrown them.
Use analytics to find product-market fit
The ‘Eureka’ moment for any founder is when it becomes clear that there’s a real, genuine market for their product.
Are people willing to pay for your product or service? In a startup’s early days, that can be surprisingly difficult to know… but analytics can help.
Retention cohorts are the magic metric that will shatter any illusions and help you to understand the demand for your product early enough to go back to the drawing board if there’s a problem. It shows whether the same group or ‘cohort’ of users is coming back week after week to engage with your product and derive value from it.
You can visualize all of this in a cohort retention chart – an easy way to see, at a glance, whether you’ve hit the sweet spot, or whether there’s a hole in your funnel that you urgently need to fix.
This graph shows what that looks like, so a startup can start to understand whether a product is sticky or not:
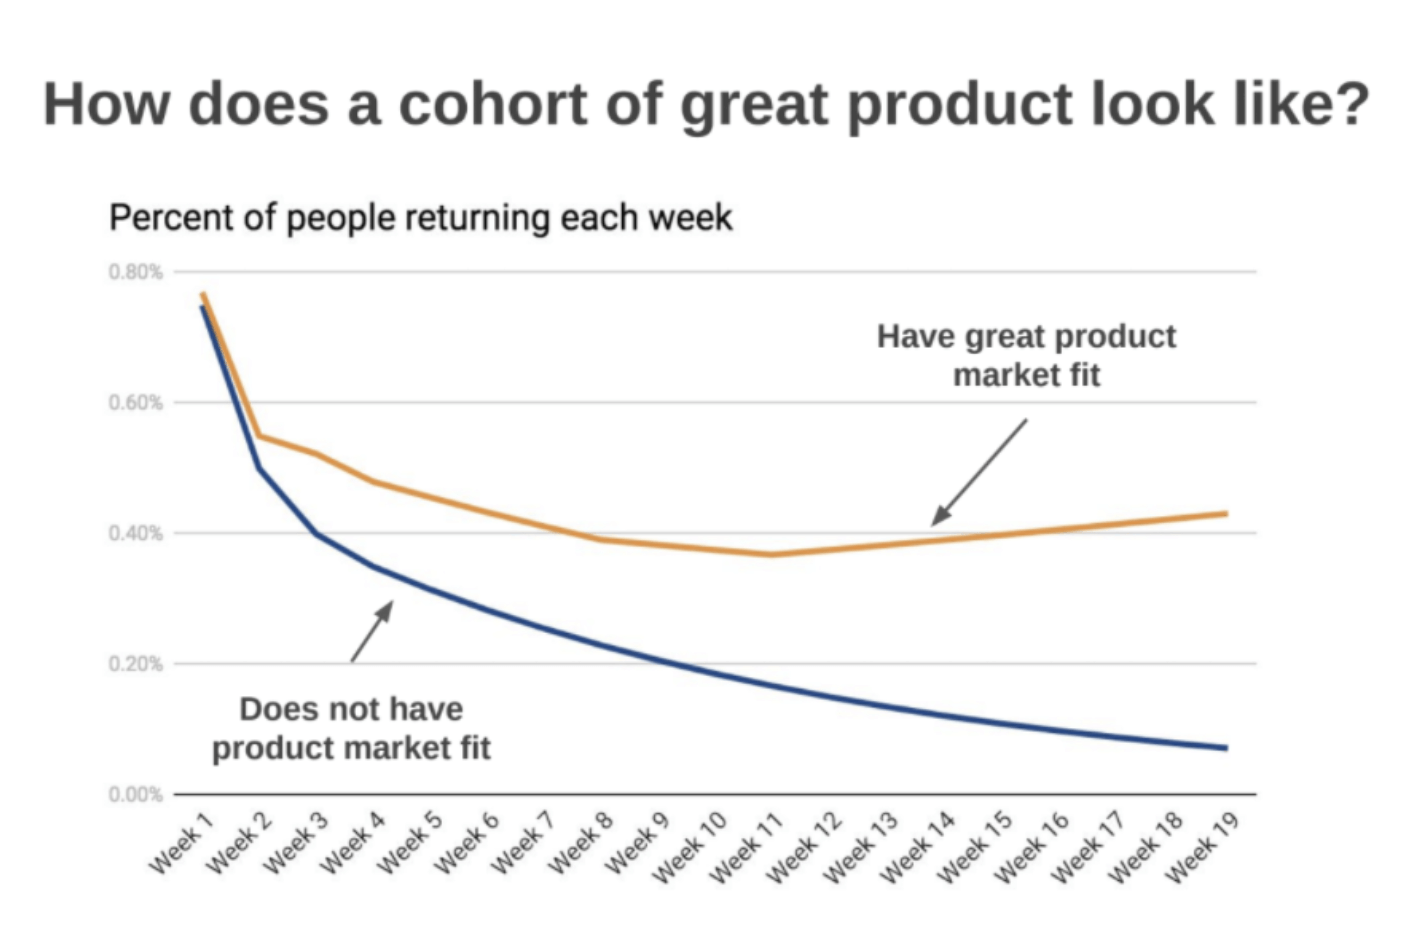
This diagram follows a set cohort of 100 users over time. Each week, it tracks how many of them engaged with the product.
Products with strong product-market fit will see users continue to do this over time, whereas products with no product-market fit will see the engagement percentage gradually drop off. This kind of cohort chart can be generated in a tool like Amplitude.
Spotify, for example, might track the percentage of users listening to at least one song a week. If the cohort sticks around, things are looking good – but as the weeks go by, the company will know it’s time to switch things up if users stop listening to any music at all.
Turn insights into action
Understanding how to measure something is one thing, but acting on it is another. To have any value, your metrics need to be regularly shared with team members who can use them to identify and solve issues quickly and decisively.
My biggest piece of advice here would be to focus on bringing your team together on a single metric. One Metric That Matters (OMTM) is a powerful concept around which you can align your entire company.
When you share metrics amongst your team (and ideally your entire organization), they should be able to easily understand what each metric means and how it aligns with your broader objectives. A real-time dashboard is a powerful way to motivate and focus your teammates around a key metric objective, and since it updates automatically and can be easily shared via URL links, it’s easy for everyone to access and action throughout your company.
It can also be valuable to send a regular, high-level email to your investors, highlighting week-over-week or month-over-month changes to your core metrics. This keeps the company accountable, showcases your successes, and helps investors to see the projects and initiatives that need their support and advice.
One last thing. When focusing on metrics, it’s key that you avoid totals. We often see teams make the mistake of tracking feel-good metrics like Total Active Users or Total API Requests. Measuring totals gives you only half of the picture – they’re just vanity metrics.
Instead, measure things like conversions, growth, customer engagement, and customer satisfaction. Only then can your teams begin to make the adjustments needed to keep those retention cohorts looking peachy.
Did someone say data?
Data analytics are no longer a ‘nice-to-have’, but essential to success from day one. The good news is that, with the current wealth of tools available on the market, even the youngest company can use first-party data to make better decisions, earlier.
Interested in finding out more and unlocking the ultimate analytics setup for free? Apply for the Segment Startup Program, which gives startups free access to tools and bespoke training to help master data analytics from the earliest stages of their business.